Recently, the S&P 500 ($SPX) has been racking up a good number of wins.
Since late April, the index has logged its third winning streak of at least five: a nine-day streak from April 22–May 2 and a six-day streak from May 12–May 19. That makes for a cluster of long winning streaks, which is something that also showed up in late 2023 and mid-2024.
To put it simply, these bunches of buying usually show up in uptrends. Note how there were no five-day winning streaks during the three corrections pictured on the chart below (in August–October 2023, July–August 2024, and February–April 2025). Most of the clusters happened as the S&P 500 was in the middle of a consistent upswing; the only time we saw a long winning streak occur right before a big downturn was in late July 2024. That came after a strong three-month run from the April lows, with the S&P 500 gaining 14% in three months.
CHART 1. WINNING STREAKS IN THE S&P 500. Since late April, the S&P 500 has logged a nine-day streak from April 22 to May 2 and a six-day streak from May 12 to May 19.
Currently, the SPX is up 23% in just under two months. It wouldn’t be surprising to see a break in the action at some point soon.
The key difference between now and July is that back in July, the S&P 500 was making new highs for two straight months. That’s not the case now, as the index is still below the February 2025 highs. So it’s not apples to apples, but, at some point, the market will have to deal with more than a minor pullback once again.
Sentiment Check
After the close on Wednesday, I ran an X poll asking if the 0.01% move was bullish or bearish. The result: 61% said bullish.
This tells us that most people saw Wednesday’s pause as a sign that the bears are unable to push the market higher, which could be true. But it also suggests complacency. The onus still is squarely on the bears to do something with this, with the only true sign of weakness in the last six weeks coming on May 21, when the S&P 500 plummeted 1.6%. That ended up being an aberration… for now.
UBER Stock: One to Watch
Sometimes, a specific stock can provide clues about the broader market’s next step. Right now, we think that the stock is UBER.
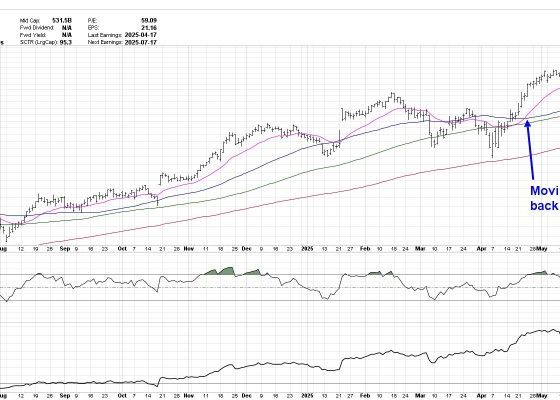
Technically speaking, UBER is at a critical spot, and it’s also an important stock given that it was one of the first growth names to break out to new all-time highs. The stock remains in a long-term uptrend, which, of course, is bullish, but it has quietly pulled back 13% from its May 20 high of $93 and was just down nine out of 10 trading sessions (see the weekly chart of UBER stock). We can see that the stock has fully retraced the price action from the pattern breakout near $82.
CHART 2. WEEKLY CHART OF UBER STOCK. The stock is in a long-term uptrend, although it has retraced. Here’s where things get really interesting. UBER has now formed a potential bearish head-and-shoulders pattern, seen on the daily chart. If the stock breaks below $82, it will target the 71-zone.
CHART 3. DAILY CHART OF UBER STOCK. Will UBER’s stock price hold support or break below it? This chart is one to monitor.
So, here are three outcomes to watch for. UBER’s stock price could:
Hold support (bullish). Break below $82, but then reverse higher, which would be a bear trap (bullish). Break below $82 and continue lower and hit the downside target (bearish).If #3 occurs, the odds are UBER won’t be declining by itself; it’ll likely drag the broader market down with it. This shows the significance of UBER stock, which certainly makes it one to keep an eye on.


